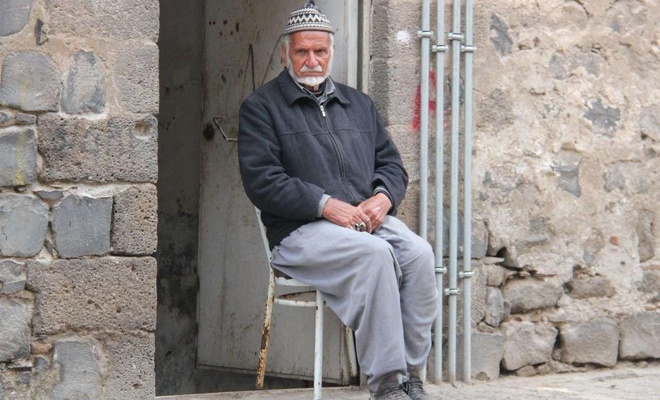
Turkey’s elderly population rises by 22.5% in last five years
The elderly population in Turkey has increased by 22.5% in the last five years, the Turkish Statistical Institute said in a statement on Thursday.
 Google News'te Doğruhaber'e abone olun.
 While the elderly population including 65 years and over was 6 million 495 thousand 239 persons in 2015, it increased by 22.5% in the last five years and became 7 million 953 thousand 555 persons in 2020, according to the statement.
While the proportion of the elderly population in the total population was 8.2% in 2015, it increased to 9.5% in 2020. 44.2% of the elderly population was males and 55.8% was females in 2020.
According to the population projections, the proportion of elderly population was expected to be 11.0% in 2025, 12.9% in 2030, 16.3% in 2040, 22.6% in 2060 and 25.6% in 2080.
63.8% of the elderly population was in the 65-74 age group
When the elderly population was examined by age group, it was seen that while 61.3% of the elderly population was in the age group of 65-74, 30.7% of it in the age group of 75-84, and 8.0% in the age of 85 and over in 2015, 63.8% of the elderly population was in the age group of 65-74, 27.9% of it in the age group of 75-84 and 8.4% in the age of 85 and over in 2020.
The age structure of Turkey's population was changed
Passing the proportion of 10% of the elderly population in the total population is an indicator of the aging population. In Turkey, the elderly population increased at a speed higher than that of other age groups.
Turkey is in the process of demographic transition, which is called the global aging process. Turkey's shape of age structure changed with advances in public health, better living conditions, increases in welfare level and life expectancy along with decreasing rates of fertility and mortality. The proportion of children and youth in the total population decreased, whereas the proportion of elderly people in the total population increased. Even though Turkey has a young population among countries with an older age structure, the absolute number of the elderly population is quite high.
The median age of Turkey's population increased
The median age is the age of the person in the middle when the ages of all people in the population are sorted from the new-born baby to the oldest. The median age, one of the indicators of an aging population, was 31.0 in 2015 and 32.7 in 2020. The median age was 32.1 for males and 33.4 for females in 2020.
According to the population projections, the median age was expected to be 34.1 in 2025, 35.6 in 2030, 38.5 in 2040, 42.3 in 2060, and 45.0 in 2080.
The elderly dependency ratio was 14.1% in 2020
The elderly dependency ratio means that the number of elderly persons per hundred persons in working age. While the elderly dependency ratio was 12.2% in 2015, this ratio increased to 14.1% in 2020.
According to the population projections, elderly dependency ratio was expected to be 16.4% in 2025, 19.6% in 2030, 25.3% in 2040, 37.5% in 2060 and 43.6% in 2080.
Turkey was in the 66th rank among 167 countries by the proportion of the elderly population
According to the population estimates, the world population was 7 billion 693 million 348 thousand 454 people and the elderly population was 729 million 887 thousand 660 people in 2020. According to these estimates, 9.5% of the world's population was elderly population. The three countries that had the highest proportion of the elderly population were Monaco with 33.5%, Japan with 28.5%, and Germany with 22.9%, respectively. Turkey was in the 66th rank among 167 countries.
When a person reached at the age 65, the average remaining life span was 18.0 years
According to the results of Life Tables, 2017-2019, life expectancy at birth was 78.6 years in total, 75.9 years for men and 81.3 years for women in Turkey. In general, women live longer than men and the difference in life expectancy at birth was 5.4 years.
In Turkey for persons at 65 years old, the average remaining life span was 18.0 years for total, 16.3 years for males, and 19.6 years for females. In other words, for persons at 65 years old, women were expected to live 3.3 years more than men on average. In addition, life expectancy was 11.0 years at 75 years old and 6.0 years at 85 years old.
There was at least one elderly person in about one in 4 households
In Turkey, 5 million 903 thousand 324 of 24 million 604 thousand 86 households consisted of at least one elderly person in 2020. In other words, at least one elderly person lived in 24% of households.
There were 1 million 478 thousand 346 elderly people living alone in Turkey
1 million 478 thousand 346 of 5 million 903 thousand 324 households with at least one elderly person living alone. 75.3% of one-person households were elderly females and 24.7% were elderly males.
The province with the highest proportion of the elderly population was Sinop
The province that had the highest proportion of the elderly population was Sinop with 19.8% in 2020. This province was followed by Kastamonu with 18.6%, Artvin with 17.1%. The province that had the lowest proportion of the elderly population was Şırnak with 3.4%. This province was followed by Hakkari with 3.6%, Şanlıurfa with 4.0%.
When the proportions of the elderly population is analyzed at the provincial level by years, the number of provinces with the highest rate of the elderly population in the total population was 6 in 2015, and 18 in 2020. According to population projections, it was estimated that the number of provinces with the highest proportion of the elderly population will increase to 33 in 2025.
It was observed that the provinces with the lowest proportion of the elderly population in the total population are Şanlıurfa, Şırnak, and Hakkari, which have a young population structure.
The number of centenarians was 5 thousand 780
The number of centenarians which constituted 0.1% of the elderly population was 5 thousand 780 in 2020. While the first three provinces that had the highest centenarians were İstanbul with 800 persons, Ankara with 267 persons and İzmir with 262 persons, the first three provinces that had the lowest centenarians was Bayburt with 5 persons, Bartın with 6 and Ardahan with 7 persons.
The proportion of the educated elderly population increased
While the proportion of the illiterate elderly population was 21.9% in 2015, it decreased to 16.9% in 2019. It was seen that the proportion of the illiterate elderly female population was 4.8 times higher than that of the elderly male population in 2019. While the proportion of the illiterate elderly female population was 26.0%, this proportion was 5.4% for the elderly male population.
When the level of education of the elderly population was examined, it was seen that while 43.0% of the elderly population was in primary school, 5.2% of them was junior high school or equivalent/primary education, 5.6% of them was high school or equivalent, 5.4% of them was higher education graduates in 2015, these proportions increased to 45.5% in primary school, 7.3% in junior high school or equivalent/primary education, 7.5% in high school or equivalent and 7.0% in higher education graduates in 2019.
When the level of education of the elderly population was examined by sex, it was seen that there was a significant difference between sexes. It was seen that the proportion of the elderly male population was higher than that of the female population at all completed levels of education.
The proportion of widowed elderly females was 4 times higher than those of males
When the elderly population was examined by legal marital status, it was seen that there was a significant difference between sexes. While 1.2% of the elderly male population was never married, 83.8% of them was formally married, 3.4% of them was divorced and 11.6% of them was widowed, it was seen that 2.6% of the elderly female population was never married, 45.8% of them was formally married, 3.8% of them was divorced and 47.7% of them was widowed in 2020.
The poverty rate was 14.2% for the elderly population
According to the results of the income and living conditions survey, while the poverty rate calculated by using 60% of equalized household disposable median income was 21.9% for Turkey in 2015, this rate was 21.3% in 2019. While the poverty rate for the elderly population was 18.3% in 2015, this rate was 14.2% in 2019.
When the poverty of the elderly population was examined by sex, it was seen that while the poverty rate for the elderly male population was 17.8% in 2015, this rate was 12.1% in 2019. While the poverty rate for the elderly female population was 18.6% in 2015, this rate was 15.9% in 2019.
The labor force participation rate was 12.0% for the elderly population
According to the results of the household labor force survey, while the labor force participation rate for 15 and over-aged population was 51.3% in 2015, this rate was increased to 53.0% in 2019. While the labor force participation rate for 65 and over-aged population was 11.9% in 2015, this rate was 12.0% in 2019. When the labor force participation rate was examined by sex, it was seen that this rate was 20.1% for the elderly male population, and it was 5.6% for the elderly female population in 2019. While the unemployment rate of the elderly population was 2.5% in 2015, it was 3.1% in 2019.
64.7% of the employed elderly population was in the agricultural sector
According to the labor force statistics, when the sectoral distribution of the employed elderly population was examined, it was seen that elderly population was employed in the agricultural sector with 64.7%, services sector with 28.1%, industry sector with 5.3% and construction sector with 1.9% in 2019.
The obesity rate of the elderly population increased
According to the Turkey health interview survey, when the body mass index calculated using height and weight values was examined, the rate of obesity in the population aged 65 and over was 22.9% in 2010, while this rate was 29.0% in 2019. When the obesity rate of the elderly population is examined by gender, it was 15.2% in 2010 for elderly men, while this rate was 19.9% in 2019, while it was 30.5% in 2010 for elderly women, it was 36.2% in 2019.
On the other hand, while the proportion of those with normal weight in the elderly population was 36.6% in 2010, this rate was 30.3% in 2019. When the proportion of the elderly population with normal weight is analyzed by gender, it was 40.2% for elderly men in 2010, while this rate was 34.9% in 2019, while it was 33.0% in 2010 for elderly women, it was 26.7% in 2019.
The proportion of the elderly population who have difficulty in bathing/showering was 22.1%
According to the Turkey health interview survey, while the rate of those who had difficulty in bathing/showering among the elderly population in 2014 was 19.1%, this rate was 22.1% in 2019. When the proportion of the elderly population having difficulty in bathing/showering is analyzed by gender, it was 11.9% for elderly men in 2014, while this rate was 14.5% in 2019, while it was 24.6% in 2014 for elderly women, it was 28.0% in 2019.
On the other hand, while the proportion of the elderly population who had difficulty in going to bed/getting up or sitting in the chair/standing in 2014 was 19.0%, this rate was 20.6% in 2019. When the proportion of the elderly population who has difficulty in going to bed/getting up or sitting in the chair/standing is examined by gender, it was 13.2% for elderly men in 2014, while this rate was 14.0% in 2019, while it was 23.4% in 2014 for elderly women, it was 25.9% in 2019.
The proportion of the elderly population who daily use tobacco products was 10.5%
According to the Turkey health interview survey, while the proportion of those who daily use tobacco products among the elderly population in 2014 was 9.3%, this rate was 10.5% in 2019. When the proportion of the elderly population who daily use tobacco products is analyzed by gender, it was 17.6% for elderly men in 2014, while this rate was 17.7% in 2019, while it was 3.0% in 2014 for elderly women, it was 4.9% in 2019.
On the other hand, while the rate of those who have never used tobacco products among the elderly population in 2014 was 58.5%, this rate was 59.4% in 2019. When the proportion of the elderly population who has never used tobacco products is analyzed by gender, it was 23.7% in 2014 for elderly men, while this rate was 26.6% in 2019, while it was 85.3% in 2014 for elderly women, it was 85.2% in 2019.
Elderly people died mostly from diseases of the circulatory system
According to the death and causes of death statistics, 41.5% of elderly people lost their lives from diseases of the circulatory system in 2019. This was followed by neoplasm diseases and respiratory system diseases with 15.3% and the nervous system and the sense organs diseases with 5.3%.
When the causes of death were examined by sex, it was seen that the most important difference between sexes was in neoplasm diseases. The proportion of elderly male people who died from neoplasm diseases was about twice as high as that of elderly female people. While the proportion of elderly male people who died from neoplasm diseases was 20.0%, this proportion was 10.7% for elderly female people.
The proportion of elderly people who die from Alzheimer's disease increased
According to the death and causes of death statistics, while the number of elderly people who died from Alzheimer's disease was 12 thousand 59 in 2015, it increased to 13 thousand 498 in 2019. While the proportion of elderly people who died from Alzheimer's disease was 4.3% in 2015, this proportion remained the same in 2019.
When the proportion of elderly people who died from Alzheimer's disease was examined by sex, it was seen that there was a decrease in males, increase in females. While the proportion of elderly people who died from Alzheimer's disease was 3.4% for males and 5.2% for females in 2015, these proportions decreased to 3.2% for males, increased to 5.4% for females in 2019.
The proportion of elderly people who declared themselves as happy was 57.7%
According to the results of the life satisfaction survey, while the proportion of individuals aged 18 and over who declared themselves as happy was 48.2% in 2020, this proportion was 57.7% for individuals aged 65 and over. When the general level of happiness was examined by sex, 56.1% of elderly males and 59.0% of elderly females declared themselves as happy in 2020.
The Source of happiness for elderly people was their families with 66.9%
According to the results of the life satisfaction survey, sources of happiness for elderly people were their families with 66.8%, their children with 16.5%, their grandchildren with 7.3%, and their spouses with 4.7% in 2015. In 2020, sources of happiness for elderly people were their families with 66.9%, their children with 16.9%, their grandchildren with 6.8%, and their spouses with 5.4%.
The proportion of elderly people using the Internet increased by 5 times
According to the results of information and communication technology usage survey in households and by individuals, while the proportion of elderly people using the Internet in the 65-74 age group was 5.6% in 2015, this proportion increased to 27.1% in 2020. When the elderly people using the Internet were examined by sex, it was seen that males used the Internet more than females. While the proportion of elderly males using the Internet was 34.9%, the proportion of elderly females was 20.4% in 2020. (ILKHA)


Bu haberler de ilginizi çekebilir
-
A tragic accident occurred on Sunday when a small plane with 10 people aboard crashed into shops in the heart of Gramado, a popular tourist city in southern Brazil.
-
The offshore quake took place in the Mediterranean Sea off the Datça district of Türkiye's Mugla province at 22:09 on Sunday.