TurkStat releases “Small and Medium Sized Enterprises Statistics 2019” survey
In Turkey, enterprises that employ less than two hundred and fifty employees annually and whose annual net sales revenue or financial balance do not exceed 125 million Turkish Liras are defined as Small and Medium-Sized Enterprises (SMEs).

 Google News'te Doğruhaber'e abone olun.
 According to the survey, 3 million 221 thousand enterprises operating in the industry and service sectors are included in SMEs.
SMEs constituted 99.8% of the total number of enterprises in 2019. On the other hand; they constituted 72.4% of employment, 51.8% of personnel costs, 50.4% of turnover, 44.1% of production value and 44% of added value at factor costs.
SMEs mostly operated in the trade sector
According to the statistical classification of economic activities (NACE Rev.2), in 2019, SMEs; while 36.3% was operating in the wholesale and retail trade, repair of motor vehicles and motorcycles sector, 14.4% them operated in the transportation and storage sector, and 12.4% in the manufacturing industry.
The highest rate in SME employment was in the trade sector
In 2019; While the ratio of SMEs employment in wholesale and retail trade, repair of motor vehicles and motorcycles in total SMEs employment was 27.4%, this ratio was 24% for personnel cost, 52.5% for turnover, 25.5% for added value at factor cost and 15.7% for production value.
Value added per employee in medium-sized enterprises had the highest value in 2019 with 108 thousand TL
While the average value added per employee for SME initiatives was 15 thousand TL in 2009, this value was 54 thousand TL in 2019. Among SME groups, the highest value added per employee for 2009 and 2019 was in medium-sized enterprises with 29 thousand TL and 108 thousand TL, respectively, while for the same years, these values were respectively 19 thousand TL and 66 thousand TL for small-scale enterprises, 8 thousand TL and 22 thousand TL for micro-scale enterprises.
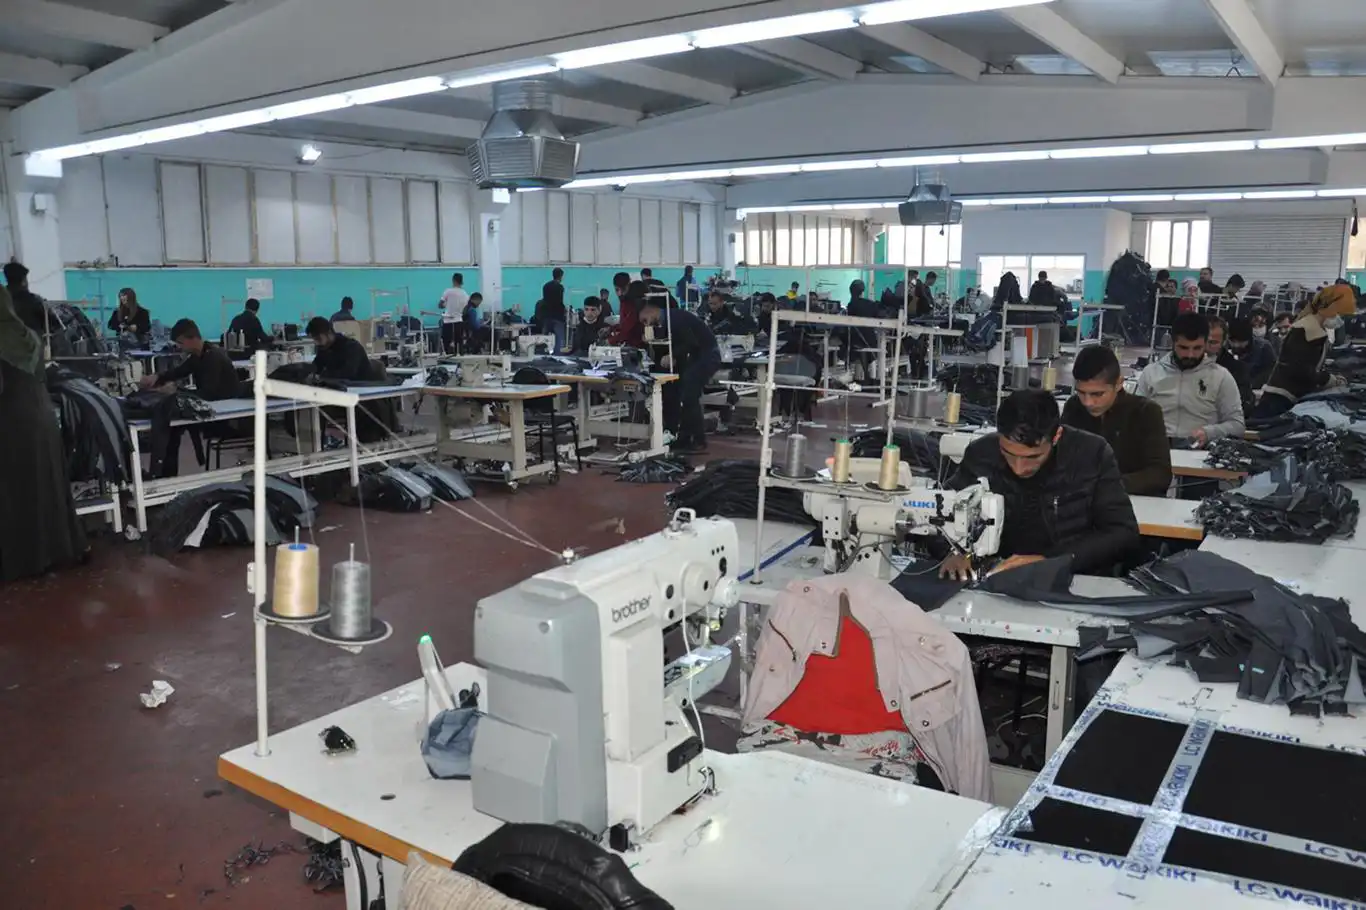
In the manufacturing industry 2 153 SMEs worked with high technology
When SMEs in the manufacturing industry are classified according to their technology levels, 56.9% of them work with low technology, while this rate was 49% in large-scale enterprises.
When analyzed according to SME size groups; 57.6% of micro-scale enterprises worked with low technology, 32.4% with medium-low technology, 9.5% with medium-high technology and 0.5% with high technology. On the other hand, these rates were 52.7%, 29.5%, 16.8% and 0.9% in small-scale enterprises, 52.6%, 27.8%, 18.1% and 1.5% in medium-scale enterprises, respectively.
SMEs made 36.6% of total exports
36.6% of total exports and 21.5% of imports for 2019 were carried out by SMEs.
In total exports in 2019; While the share of micro-scale enterprises was 3.8%, the share of small-scale enterprises was 14.1% and the share of medium-scale enterprises was 18.7%. The share of large-scale enterprises was 63.4%.
According to the main activity of the enterprises, 58.4% of the exports of SMEs were made by the enterprises operating in the commercial sector and 37.5% by the enterprises operating in the industrial sector.
The share of SMEs in imports was 21.5%
In 2019 total imports; The share of micro-scale enterprises was 1.5%, the share of small-scale enterprises was 7.5%, and the share of medium-scale enterprises was 12.5%. The share of large-scale enterprises was 78.5%.
According to the main activity of the enterprise, 63.9% of the imports of SMEs were made by the enterprises operating in the commercial sector and 30.9% by the enterprises operating in the industrial sector.
The export value of SMEs, which was 57 billion dollars in 2013, increased to 65 billion dollars in 2019. In imports, the value, which was 48 billion dollars in 2013, decreased to 43 billion dollars in 2019.
46.1% of the total exports of SMEs were made to European countries
46.1% of the exports made by SMEs in 2019 were made to European countries and 36.5% to Asian countries. SMEs made 42.9% of their imports from European countries and 47.0% from Asian countries.
91.4% of the exports of SMEs were manufacturing industry products
In 2019 exports of SMEs, the share of clothing sector was 14.4%, the share of textile products was 10.2%, and the share of machinery and equipment not elsewhere classified was 10.1%. The prominent products in the import of SMEs in 2019 was basic metals with 20.1%, chemicals and chemical products with 16.8%, machinery and equipment not classified elsewhere with 10.8% and agricultural and hunting products and related services with 6.5%.
SMEs made 31% of total R&D expenditures
SMEs made 8 billion 984 million TL of the total gross domestic R&D expenditure of financial and non-financial companies for 2019. This expenditure constitutes 31% of financial and non-financial companies R&D expenditure. A total of 112 thousand 338 people worked as R&D personnel in financial and non-financial companies in terms of Full Time Equivalent (FTE). 47.1% of these personnel in terms of FTE were employed in SMEs.
325 patents of SMEs were registered
While the total number of patent applications by SMEs was one thousand 416 in 2019, 325 patents were registered in the same year. In SME scales, the highest patent applications were made by micro-scale enterprises with 491, while medium-sized enterprises ranked first with 137 patent registrations in the number of patent registrations. (ILKHA)


Bu haberler de ilginizi çekebilir
-
Faruk Dinç, Vice President and Head of Youth Policies for HÜDA PAR, addressed young attendees at an open-air event held in Botanik Park, located in Bursa's Osmangazi district.
-
State television reported on Sunday that a helicopter carrying Iranian President Ebrahim Raisi experienced a "hard landing," prompting extensive search operations amid poor weather conditions.